Using Q&A Preview within PowerBI Desktop
PowerBI Online has a great feature within it that allows the users to create dashboard tiles just by asking questions, and this has always been a crowd pleaser to show to the users.
But if you have been using the PowerBI Desktop to create your reports then you have had to do this the hard way by manually selecting the fields.
Great news. There is a Preview feature that is now available within PowerBI Desktop that adds that same natural language query option that is available within PowerBI Online, but now it is within PowerBI Desktop.
In this article we will show you how to enable this feature and also how it works.
How to do it…
Step 1: Click File, Options & Settings and then Options
To do this we will need to turn on one of the preview features.
To do this just click on the File button, click on the Options & Settings button and click on the Options button.

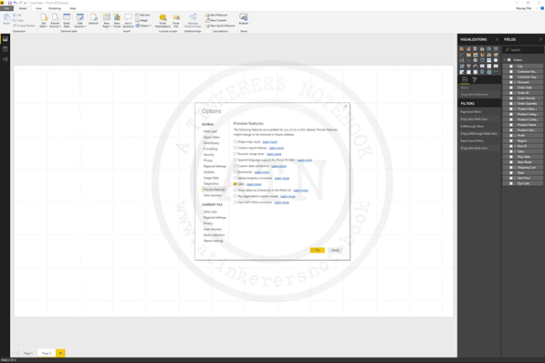
Step 2: Click Preview features
When the Options dialog is displayed, we will want to switch to the tab that shows all of the preview features.
To do this just click on the Preview features button.

Step 3: Toggle the Q&A
Now we will want to enable the Q&A feature within PowerBI.
To do this we will just need to toggle the Q&A option.
For this example, we will want to click on the Q&A toggle switch and set it to the Checked value.
How it works…
Step 4: Click Add a Question
When you restart PowerBI you will now be able to see a new Ask a Question button in the ribbon bar.
If we want to start a Q&A chart then we can use the button on the ribbon bar.
To do this just click on the Add a Question button.

Step 5: Double click on report Canvas
Another way that we can start a Q&A tile is within the report canvas itself.
To do this, just double click on the reporting canvas
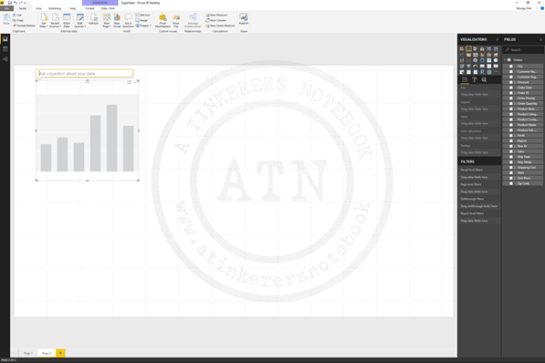
Step 6: Update the Q&A
Now we can start asking for our report through the Q&A box..
To do this we will just need to update the Q&A value.
For this example, we will want to set the Q&A to sales.
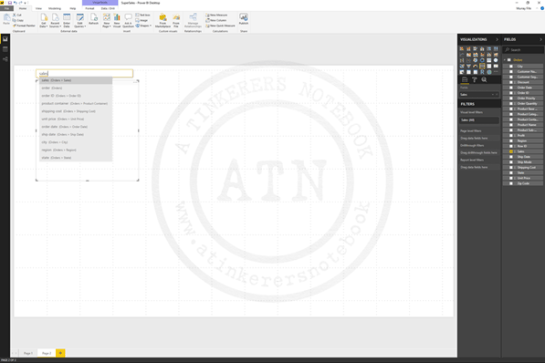
Step 7: Update the Q&A
We can also add some dimension to the report, and maybe segregate out the sales by geography.
To do this we will just need to update the Q&A value.
For this example, we will want to set the Q&A to by state.
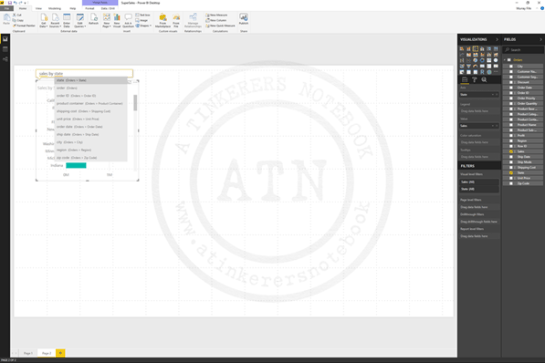
Step 8: Update the Q&A
And we can reimaging the cart as a map using the standard report type within PowerBI.
To do this we will just need to update the Q&A value.
For this example, we will want to set the Q&A to as map.
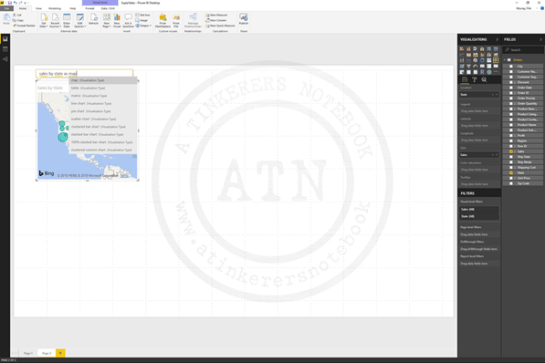
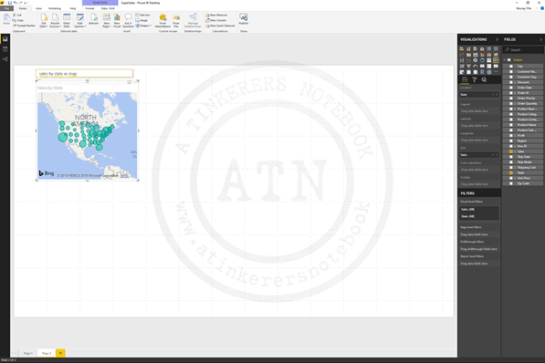
This will give us a simple map showing us all of the sales by state shown as a map.
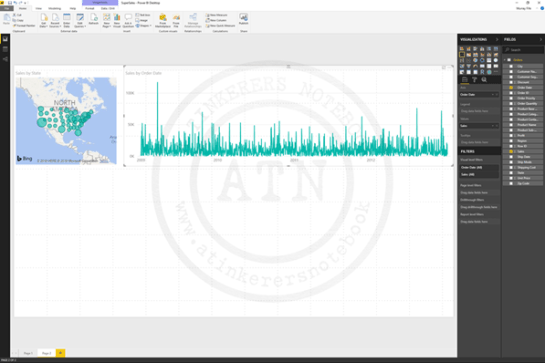
Step 9: Click Add a Question and update the Q&A
We can create more of these report tiles using the Q&A feature as well. Let’s look at the sales data over time.
To do this just click on the Add a Question button and update the Q&A value.
For this example, we will want to set the Q&A to sales by date. and set the Q&A to sales by state.

Now we have a report that shows us the sales by state, and also the sales over time.
Summary
How cool is that. Now we can create our reporting tiles within PowerBI Desktop just by asking questions.
