Cause of death: two systems that had never spoken before were shown having a conversation written for them.
The presenter switches windows. A record gets created in System A. A few seconds later, as if by magic, the corresponding record appears in System B, fully formed, correctly mapped, no errors. “And that’s it,” the presenter says, “they just talk to each other.” The room relaxes. Integration, historically the single most reliable way for an implementation to go over budget and past deadline, has apparently been solved by two systems having a friendly chat while everyone watched.
Nobody in the room asks what was actually watching that conversation, or who taught it what to say. That’s the autopsy. The two systems didn’t learn to talk to each other. Someone wrote both sides of the script, tested it exactly once, against exactly one scenario, and ran it live in front of you.
What actually happened
An integration demo almost never shows the integration. It shows the happy path of the integration, which is a different and much smaller thing. The record that got created in System A was built to contain precisely the fields System B expects, in precisely the format System B expects them, with no null values in the fields that would trigger a mapping error, no duplicate keys, no encoding mismatch, none of the thousand small inconsistencies that live in a company’s actual data the moment more than one person or one legacy system has touched it.
The script connecting the two systems, whether it’s a middleware platform, a custom connector, or a scheduled job, was very likely written specifically for this demo, tuned against this one scenario, and has never been asked to handle a partial failure, a duplicate record, a field that arrives populated in one system and empty in the other, or a timeout on either end. It works, in the same sense that a bridge works if you only ever drive one specific car across it at one specific speed.
The part that never gets demoed, because it can’t be demoed in three minutes, is everything that happens when the sync fails halfway through. Does the transaction roll back cleanly on both sides, or does System A now believe the record synced while System B never received it. Is there a retry, and if so, does the retry create a duplicate. Is there an alert, and does it go to a person who is actually watching for it, or does it silently populate an error log nobody has looked at since the demo environment was built.
Why it works on smart people
Integration failures are, structurally, invisible until they aren’t. A sync that fails silently doesn’t announce itself. It just produces a slowly widening gap between what System A believes is true and what System B believes is true, and that gap is usually discovered by someone downstream, weeks or months later, reconciling numbers that don’t match and trying to figure out why.
Because the failure mode is invisible, “the demo showed it working” carries more weight than it should, simply because there’s no immediately visible counter-evidence in the room. A broken UI is obvious the moment you see it. A broken integration is obvious only in the reconciliation report nobody runs until month-end close, by which point the demo is a distant memory and the sales team has moved on to the next opportunity.
There’s also a vocabulary problem working in the vendor’s favor. “They just talk to each other” is a satisfying sentence, and it papers over an enormous amount of engineering that either exists, robustly, behind that sentence, or doesn’t exist yet and was built specifically to survive one scripted run.
The actual damage
This is the one that shows up as a reconciliation nightmare rather than a single dramatic failure. Two systems that were sold as integrated drift slowly apart in the weeks after go-live, each one silently correct according to its own records, disagreeing with the other in ways nobody notices until an audit, a customer complaint, or a finance close turns up numbers that don’t tie out. By then the question isn’t “does the integration work,” it’s “how long has it not been working, and what decisions got made on bad data in the meantime.”
The remediation is almost always more expensive than building the integration correctly the first time would have been, because now it includes both the engineering fix and a data cleanup project to reconcile however many weeks or months of silent drift accumulated before anyone noticed.
The fix, if you’re the one presenting
Show a failure on purpose. Send a record with a missing required field, or a duplicate key, and show what happens: does it error visibly, does it queue for retry, does someone get notified, does the other system stay in a known, correct state while the problem gets resolved. If the honest answer is “we haven’t built that handling yet,” say that, and say what the plan is. A prospect who sees a deliberate, controlled failure and a sane recovery path trusts the integration more than one who only ever saw the happy path, because they now know what happens on the day, and there will be a day, when the happy path isn’t what shows up.
Two systems that have never disagreed in front of you haven’t been integrated. They’ve been introduced.
This is exactly the failure mode a ledger-first architecture is built to make impossible. In Is Headless ERP Enough, or Just a Step in the Right Direction?, I walk through a prototype where two disconnected nodes post independent transactions and converge without conflicts, with no consensus protocol and no room for one system to quietly believe something the other doesn’t.
Cause of death: the case study was true, and that’s exactly the problem.
Two-thirds of the way through the deck, a new logo appears. A real one, a company you’ve heard of, sometimes a competitor’s supplier or a name from your own industry vertical. The slide has a number on it, usually a big one: forty percent reduction in close time, three million recovered in duplicate payments, six months to positive ROI. Underneath the number is a quote, attributed, sometimes even video, from a real person who really said those words.
Nothing on that slide is fabricated. That’s what makes this one the hardest autopsy in the series. The other demos in this blog die from omission, pacing, or seamlessness hiding a seam. This one dies from something subtler: a true statement about one company, presented in a context engineered to make you believe it’s a claim about yours.
What actually happened
The reference customer on the slide is not a random sample. It is, almost by definition, the single best outcome the vendor has produced across their entire installed base, selected specifically because the number is large and the customer is willing to say it out loud. Somewhere behind that slide are dozens or hundreds of other implementations that landed closer to the median, plus a smaller number that struggled or stalled, none of which get a logo or a quote, because nobody puts “we got most of the way to the business case, eventually, after two scope changes” on a slide.
There’s also a matching problem the case study never surfaces. The reference customer’s forty percent reduction in close time happened inside a specific starting condition: a particular level of process maturity, a particular data quality baseline, a particular willingness internally to change how work got done. The case study tells you the outcome. It almost never tells you the starting line, and the outcome without the starting line is not a number you can subtract your own situation from.
The quote does real work here too. A specific named person saying a specific thing on camera reads as harder evidence than an aggregate statistic, even though a single testimonial is a sample size of one, hand-selected from a population the vendor controls entirely.
Why it works on smart people
Humans are wired to trust specific, named, social proof more than abstract statistics, and this isn’t a flaw, it’s usually a reasonable heuristic. A named person willing to put their reputation behind a claim on camera is, in most contexts, more credible than an anonymous number. The problem is that the heuristic evolved for a world where the sample in front of you was roughly representative of the population, and a vendor-selected reference customer is the opposite of representative by construction.
There’s a second effect working alongside the first. By the time the reference slide appears, you’ve usually already sat through thirty or forty minutes of a demo that felt competent, so the case study isn’t landing on a skeptical audience, it’s landing on an audience that has already been primed to trust what they’re being shown. The reference customer isn’t doing the persuading alone. It’s the closing argument after the room has already been warmed up.
The actual damage
This is the one that turns into an internal expectations problem before it turns into a vendor problem. Someone in the room, often not maliciously, repeats the number in an internal steering committee deck as though it were a forecast rather than someone else’s outcome. “Similar companies have seen a forty percent reduction” quietly becomes “we’re targeting a forty percent reduction,” and by the time the project charter gets written, a single best-case data point from a different company, with different starting conditions, has become your project’s success criteria.
When your actual results land closer to the median, which is where most results land by definition, the project doesn’t get judged against a realistic baseline. It gets judged against the reference customer’s outcome, which nobody on your team ever should have agreed to as the target in the first place.
The fix, if you’re the one presenting
Show the range, not just the peak. If you have a reference customer at forty percent, say what the twenty-fifth and seventy-fifth percentile outcomes look like too, and say why the reference customer landed where they did, what was true about their starting point that might or might not be true about the prospect’s. A specific, named case study is still worth showing. It’s worth showing better, with its context attached, instead of as a number floating free of the conditions that produced it.
The honest version of that slide is less dramatic. It’s also the only version that survives contact with a steering committee eighteen months later.
This is the same shift I wrote about in The New Expert Isn’t the One With the Answers. Having the number was never the hard part. Knowing whether that number applies to your situation is.
Cause of death: the feature that closed the deal was never actually in the room.
Somewhere around minute forty of the demo, the presenter hits a gap. The thing you actually asked about, the reason you took the meeting, doesn’t quite exist yet. What happens next is the tell. The slide doesn’t say “we don’t do that.” It says “coming in the next release,” said in exactly the same tone of voice as everything that already works, with exactly the same confident click-through pacing, so that by the time the meeting ends, the feature that doesn’t exist has fully merged in your memory with the fifteen features that do.
Nobody lied. That’s what makes this one interesting to cut open. The roadmap slide was real. The quarter listed on it might even be accurate, as of the day the deck was built. And yet the effect on the room is functionally identical to a lie, because a promise wearing a product demo’s clothing gets evaluated with a product demo’s scrutiny, which is to say, almost none.
What actually happened
Every roadmap item in a sales deck starts life as an engineering estimate, gets filtered through a product manager’s optimism, gets filtered again through a sales engineer who needs this quarter’s number, and arrives in front of you as a single, confident bullet point that has shed every unit of uncertainty it was born with. “Q3” meant “Q3, if the two prerequisite features land on time and nothing gets reprioritized” back at the whiteboard where it was written. By the time it’s read aloud in your conference room, it just means Q3.
The demo compounds this by never distinguishing, in pacing or tone, between the click that shows something real and the click that shows a mockup of something planned. Both get the same enthusiasm. Both get the same “and here’s where you’d.” The interface doing the showing doesn’t have a font for “this is a Figma file with a database connection painted on.”
You are, in effect, being shown two different products stitched into one seamless walkthrough: the one that ships today, and the one that exists only as a commitment on a slide, and you’re being asked to make one buying decision that covers both.
Why it works on smart people
Buyers are trained, correctly, to evaluate a vendor’s direction and not just their current state. Nobody wants to buy a system that solves today’s problem and ignores next year’s. So a roadmap conversation is a legitimate, necessary part of due diligence. The trick isn’t the existence of the roadmap. It’s the demo borrowing the roadmap’s credibility and lending it back to itself.
There’s also a timing problem working against you. The roadmap feature is almost always introduced as the answer to the exact gap you just identified in the product, which means it lands at the precise moment you’re feeling a little disappointed and looking for a reason not to be. “Coming in Q3” isn’t just information at that point. It’s relief, and relief is a bad state to be evaluating claims in.
The actual damage
This is the one that shows up on a signed contract with a footnote nobody reads until it matters. Somewhere a business case got built with the roadmap item load-bearing in it, sized as though it were a current-state capability, because in the meeting it felt like one. The actual purchase decision, the one with budget and a signature attached, priced in a feature that was, at signing, a Jira ticket with a target quarter next to it.
Q3 arrives. The feature either doesn’t ship, ships in a reduced form that solves half the original problem, or ships correctly but a year later, after a reprioritization nobody outside the engineering org heard about. Your business case, however, was built on the version of the feature that existed only in the demo room, and now someone has to explain to their own leadership why the thing everyone signed off on isn’t the thing they got.
The vendor isn’t necessarily acting in bad faith here. Roadmaps genuinely slip, for genuinely defensible reasons. But “the vendor wasn’t lying” is cold comfort to the person holding a business case that assumed a delivery date as fact.
The fix, if you’re the one presenting
Change the font, literally or figuratively, the instant you cross from shipped to planned. A different slide background, a verbal flag, a pause, anything that makes the seam audible. Say the confidence level out loud: “this is committed and in QA,” versus “this is prioritized but not yet started,” versus “this is directionally where we’re headed and I wouldn’t bet a contract on the date.” Those are three different products. Let the buyer evaluate them as three different products.
It costs you a little bit of momentum in the room. It buys you a customer who signs with accurate expectations, which is the only kind of customer who’s still happy with you eighteen months later.
The roadmap wasn’t the lie. The seamlessness was.
I’ve argued elsewhere that no self-respecting architect leaves the scaffolding up once the building is done. A roadmap slide is the one place I’d argue for the opposite: leave the scaffolding very visible, since half of what’s on screen hasn’t been built yet.
Nobody has ever finished a day of data entry in an ERP system and felt like they’d been playing a game. That’s the problem gamification tries to solve, and after years of poking at enterprise systems, I’ve become convinced it’s one of the more underrated levers for actually getting people to use the software correctly.
The pitch
Gamification means borrowing the mechanics that make games compelling: points, badges, levels, progress bars, leaderboards, and bolting them onto tasks nobody would otherwise choose to do carefully. In an ERP context, that might mean a purchasing clerk earning a badge for zero-error PO entry for a month, a warehouse team seeing a live leaderboard of pick accuracy, or a new hire working through a “level up” onboarding path instead of a 40-tab training binder.
It’s not a gimmick dreamed up by a UX consultant with too much time on their hands. There’s real academic backing here. A well-cited study built a gamification prototype on top of SAP ERP and tested it with 112 users using the standard technology acceptance model; enjoyment, flow, and perceived ease of use all improved meaningfully. Another case study found that adding game mechanics to SAP increased user “telepresence” (basically, how engaged people felt while using the system) by nearly 30%. The underlying research consistently shows gamified ERP leads to better data entry and fewer errors, which, if you’ve ever had to clean up a mangled inventory count, is not a small thing.
Why now
The gamification market broadly is expected to roughly double by the early 2030s, and enterprise software is a big part of that growth. What’s changed recently is the mechanism. The old playbook was static: points, badges, a leaderboard bolted onto the sidebar, forget about it. The new playbook is AI-driven, with personalized nudges, dynamic feedback loops, and coaching that adapts to what an individual user is struggling with rather than a one-size-fits-all reward ladder. Microsoft’s Power Apps approach is a good example of the direction things are heading, embedding game-like mechanics directly into workflows rather than treating gamification as a bolt-on layer, which cuts rollout time from months to weeks.
HR and training modules are seeing the fastest uptake, which makes sense. That’s the part of ERP most people already expect to feel like a course rather than a chore, so it’s the easiest wedge for game mechanics to get in the door.
The catch
Here’s the part worth sitting with before you get excited and start slapping badges on every screen: a huge share of gamification efforts flop. The research puts the failure rate at around 80% when organizations default to generic points and leaderboards without actually designing for the behavior they want to change. A leaderboard that just measures raw transaction volume will train people to enter data fast and sloppy, not accurately. Badges nobody respects become wallpaper. And gaming mechanics don’t land the same way with every personality; some people are motivated by competition, some by mastery, some find the whole thing patronizing. The smart implementations keep traditional training and recognition paths alongside the gamified ones rather than replacing them outright.
Legacy systems are also a real drag here. If you’re still running SAP ECC or an older on-prem instance, bolting gamification on top usually means custom middleware, which stretches timelines and adds a maintenance burden nobody budgeted for. It’s a much easier build on modern cloud ERP with decent APIs.
The tinkerer’s takeaway
If I were experimenting with this on a real system today, I’d start narrow. Pick one painful, error-prone workflow, define the specific behavior I actually want to reinforce (not just “more activity”), and build a small feedback loop around that: a progress indicator, a streak counter, something visible and honest. Skip the company-wide leaderboard until you’ve proven the mechanic works on a small team that won’t quietly resent it.
ERP software has a reputation for being where enthusiasm goes to die. Gamification isn’t going to fix bad process design or a system nobody wanted in the first place, but done with a little more thought than “add badges,” it’s a genuinely useful tool for making the boring but important parts of enterprise software a little more bearable.
If you want help thinking through where gamification actually fits in your own ERP rollout, that’s exactly the kind of thing I help people work through. Get in touch at adnd365.com/start.
The four ways people manage household money aren’t just personal finance patterns. They’re organizational patterns. They show up at every scale: corner stores, venture-backed startups, mid-market manufacturers, Fortune 500 companies.
The stakes are just higher. And the failure modes are more public.
Here’s the same progression, mapped to real business behavior, and what each system actually produces in terms of profitability, resilience, and growth.
System One: The Checkbook Business
The question they ask:Is there money in the account right now?
Small businesses live here more often than most owners would admit. The restaurant owner who checks the register at the end of service. The contractor who pays suppliers when a client check clears. The freelancer who looks at the bank balance before agreeing to take on a new expense.
This isn’t incompetence. Early-stage businesses often have no choice: the margin for error is so thin that real-time cash position is genuinely the most important number. Survival runs on today’s balance.
The problem is what gets invisible.
A checkbook business knows whether it can pay this bill. It does not know whether it will be profitable this month. It does not know whether the good month it just had covered the overhead it carries, or whether it was just an unusually large receivable that finally cleared. It cannot distinguish between a solvent business having a cash-tight week and an insolvent business having a deceptively comfortable one.
The profitability trap: Many checkbook businesses are profitable on paper and bankrupt in practice. This is one of the most common ways small businesses die: not from lack of customers, not from lack of revenue, but from a sixty-day receivables gap that the owner couldn’t see coming because the system only showed today.
The technical term for this is cash flow insolvency: you have more assets than liabilities, which means you’re profitable, but you cannot pay your current obligations because the money is in the wrong place at the wrong time.
The balance looks fine until it doesn’t. And when it doesn’t, there’s no warning, because the system wasn’t designed to give one.
Real-world fingerprint: A profitable small business that always feels financially precarious. Owners who carry stress about money even in good months. Occasional crises (a big client pays late, a quarterly tax bill lands) that feel like catastrophes but are actually predictable, because they happen every year.
System Two: The Forecasting Business That Misses
The question they ask:What will revenue be this quarter?
This is where most growth-stage companies live, and where a remarkable number of them stay, stuck in a cycle of projections that don’t land.
The forecasting business has graduated from “what’s in the account” to “what are we expecting.” It runs pipeline reviews. It builds revenue projections. It presents a three-month outlook to leadership or investors. This is meaningful progress. Time is in the model now.
But the forecasts are almost always optimistic.
Sales teams project the pipeline as if every deal in the funnel will close, and close on schedule. Revenue gets projected; costs get underestimated. The plan says the new sales hire will be productive by month three; reality says month five. The contract that was “90% likely to close in Q2” pushed to Q3. The expense that was “one-time” recurs.
Month after month, the forecast is confident. Month after month, actuals come in below it.
The profitability trap: When forecasts are systematically optimistic, companies make commitments they shouldn’t. They hire ahead of revenue. They sign leases based on projected growth. They make promises to investors that require a growth rate the business can’t sustain. The result isn’t one bad quarter; it’s a structural gap between the business as it exists and the business as it was planned, and every decision made on the plan is now wrong.
The deeper problem is that optimistic forecasting hides whether the business model actually works. If you’re perpetually revising down, you can’t tell whether you’re a fundamentally profitable company having execution problems, or an unprofitable company whose numbers only look promising in the forecast.
Some of the most spectacular business failures in recent decades followed this pattern exactly. Companies with enormous revenue, strong unit economics in certain segments, and explosive growth, that were never actually profitable because the forecast kept promising that profitability was one more growth push away. The forecast became the operating reality, and the actual operating reality was never examined.
Real-world fingerprint: The company that’s always “on track for a great Q4.” Leadership that explains misses as timing issues, not model issues. Investors who hear “we’re accelerating into profitability” for six consecutive quarters. Employees who can’t quite tell whether the business is doing well or not, because the answer seems to depend on which version of the plan you’re comparing against.
System Three: The Budgeting Business
The question they ask:How did we do against the plan?
This is where professional management begins to look like professional management.
The budgeting business sets an operating plan at the start of the year: revenue targets broken down by product line, cost of goods, gross margin, departmental operating expenses, EBITDA target. Every month, actual results are compared to the plan. Variances are explained. Significant deviations trigger action.
This changes everything.
When you track budget versus actual with discipline, a few things happen that don’t happen in lower-order systems. First, you know quickly when something is wrong: not when the bank account empties, but when the variance shows up in the data. Second, the business develops institutional knowledge about how it actually operates versus how it thought it operated. Third, accountability becomes real: the sales leader can’t wave at the pipeline anymore, because the numbers are compared to a commitment.
Most importantly: a business running a real budget almost always generates more consistent, predictable profit than an equivalent business that doesn’t, because the act of planning and measuring drives better decisions.
The profitability mechanism: Budget discipline reduces the two most common causes of unexpected losses: untracked cost creep and unchecked optimism on revenue. When every department knows what it’s allocated and every shortfall gets explained, the business develops cost awareness that’s nearly impossible to maintain without the structure. Gross margins stabilize. Operating leverage improves. The business starts to compound.
This is why investors, acquirers, and lenders ask for budget-versus-actual comparisons. Not because they’re curious about the plan, but because the discipline of building and tracking a plan is itself predictive of management quality. A company that can build a realistic plan and execute close to it is a fundamentally different risk profile than one that can’t.
Real-world fingerprint: Quarterly business reviews with actual variance analysis. A CFO who knows, from memory, the gross margin by product line. A sales team that has monthly targets, not just an annual number. Financial reporting that comes out within a week of month-end, because the systems are set up to produce it. Debt covenants that get met because the business knew three months out whether it was on track.
System Four: The Capital-Planning Business
The question they ask:Where does this dollar earn the best return over time?
This is where great businesses separate from good ones.
The capital-planning business does everything the budgeting business does, and adds a layer of long-term, deliberate resource allocation. It doesn’t just ask whether this quarter’s expenses are on plan. It asks: what should this company invest in over the next three to five years to build durable profitability? Where should retained earnings go? Which capital expenditures earn above the cost of capital? Where are we building a competitive advantage, and where are we just spending?
This is the language of capital allocation, arguably the most important skill in running a business, and the one most frequently treated as secondary to sales, product, or operations.
The mechanism is thinking in returns, not just costs. A budget asks: are we spending what we planned? Capital planning asks: is the spending generating the return we need? The first question is about control. The second is about strategy.
The profitability mechanism: Businesses that allocate capital well build compounding advantages. The investment in equipment that reduces unit cost. The product development spend that expands addressable market. The customer acquisition that generates ten-year lifetime value. The acquisition that adds capability the business couldn’t build faster internally.
Done well, capital planning means that profitability doesn’t just persist; it grows. The business today is structurally more profitable than the business three years ago, because the intervening years of deliberate investment built something that competitors can’t easily replicate.
Berkshire Hathaway is the canonical example of this system at scale. Buffett has described his job, fundamentally, as capital allocation: deciding where each dollar of retained earnings earns the best long-term return. The operating businesses run their budgets. His job is to decide where the cumulative profitability of those businesses gets reinvested.
Most businesses never get here because they’re still solving earlier problems. But the ones that do, the ones that develop a real framework for evaluating long-term capital deployment against expected return, tend to generate profitability that compounds rather than flatlines.
Real-world fingerprint: A CFO who can articulate the company’s return on invested capital (ROIC) and compare it to the weighted average cost of capital (WACC). Capital expenditure proposals that include payback period analysis. A board conversation about portfolio allocation: which business lines to invest in, which to harvest, which to exit. Retained earnings that are deployed deliberately, not just accumulated. A five-year financial model that gets updated quarterly and actually informs decisions.
The Profitability Table
System
Business Type
Profit Pattern
Most Common Failure
Checkbook
Early-stage, survival-mode
Unpredictable; solvent on paper, crisis-prone in practice
Cash flow insolvency; profitable businesses going under
Never actually achieving the “next quarter” profitability
Budgeting
Mature operating business
Consistent, predictable, improvable
Profitable but not compounding; running in place
Capital Planning
High-performance, long-horizon
Compounding; structural improvement over time
None. This is the goal.
Why Businesses Get Stuck
The natural question is: why doesn’t every business just run capital planning? If it’s the best system, why doesn’t everyone use it?
The same reason people don’t run household budgets.
Budgeting requires discipline in the present to prevent pain in the future. Capital planning requires thinking clearly about the future while managing the present. Both require honest accounting, which means accepting bad news as data rather than explaining it away. All of this is harder than it sounds when you’re dealing with payroll, customers, competition, and a thousand daily decisions that feel more urgent than next year’s plan.
The businesses that move up the ladder are the ones where someone (usually a founder who lived through a cash flow crisis, or a CFO who’s seen what variance blindness costs) made the deliberate decision that the current system wasn’t good enough. That better information was worth the work required to have it.
The irony is that the work gets easier as the system improves. A business with a real budget closes its books faster, makes decisions more confidently, and recovers from setbacks more cleanly than one running on balance checks and optimistic forecasts. The discipline creates capacity, not just control.
The Household Connection
This is exactly why the household and the business are the same problem at different scales.
The person who checks their bank balance every Friday morning is running the same system as the small business owner who checks the register. The family that talks about “making it to the next paycheck” is experiencing the same structural problem as the startup that talks about “making it to the next funding round.”
The mental models transfer completely. The vocabulary is different. The amounts are different. The underlying structure (how money is tracked, what questions get asked, how far ahead the thinking extends) is identical.
Which means the upgrade path is also identical.
You don’t have to be a business to benefit from running like one. You don’t have to have investors or a board or a CFO to ask better questions about where your money goes and what return it’s generating.
The four systems aren’t corporate tools. They’re ways of thinking. The businesses that use the most sophisticated version aren’t more rigorous because they’re businesses; they’re more rigorous because they decided better information was worth the effort to have it.
That decision is available to anyone.
This post is part of the Home ERP series, exploring how enterprise resource planning concepts apply to the households we all already run.
Want to go deeper?Running a Home Like a Business walks through the complete system (budgets, cash flow, capital planning, and more) through the story of one family that runs their household with the discipline of a well-managed company.
Every ERP concept in this lab has a CRM twin. The names changed, the forms got wider, and there are more required fields, but the underlying business logic is the same. This lab maps what we already know to where it lives in Finance and Operations.
We are not building anything new yet. We are reading, navigating, and comparing. By the end, the D365 F&O navigation should feel like a dialect of a language we already speak.
Overview
This lab maps six core CRM entities to their ERP equivalents. We will navigate to each F&O form, compare the record structure to what we know from CRM, and identify which fields are new, which are renamed, and which behave differently.
We will complete six activities:
Open a customer record and compare it to a CRM account.
Review customer groups and compare them to CRM account types or segments.
Open a released product and compare it to a CRM product catalog entry.
Navigate the site and warehouse hierarchy and understand physical inventory tracking.
Open a vendor record and understand the purchase side of the same entity model.
Review currency codes and understand multi-currency in ERP.
Each activity is a guided navigation exercise. No records are created or modified.
Objective
By completing this lab, we will be able to navigate six core F&O entity forms and explain the CRM-to-ERP mapping for each.
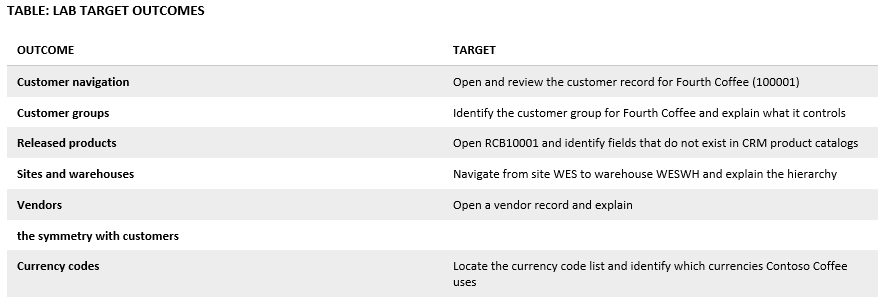
The following table defines the target outcomes for each entity mapping exercise.
TABLE: LAB TARGET OUTCOMES
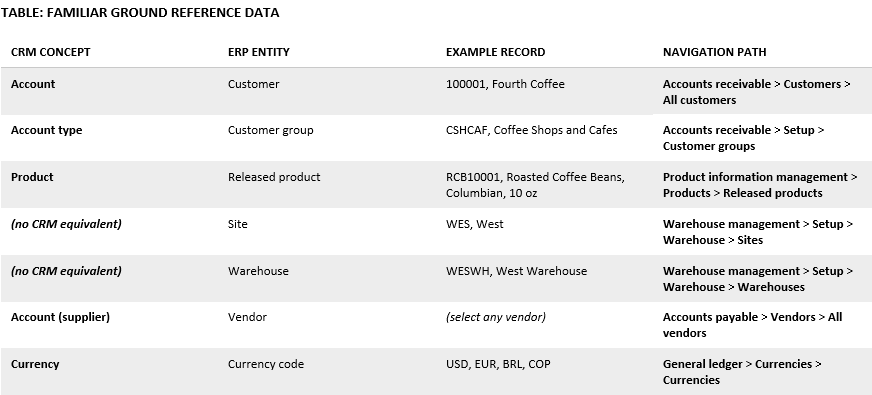
Reference Data
The following reference values support navigation during this lab. All records already exist in the Contoso Coffee database.
This article examines how the Waterdeep Trading Company applies shop floor automation across its workshops, forges, kitchens, and docks to eliminate recording delays, reduce production losses, and maintain consistent quality. It covers the foundational principles of state-based tracking, the events that drive automation, and the area-specific controls used across different production environments. A worked example traces a heated cauldron batch from ingredient issue through to inventory creation. Readers seeking a concise overview may read only the opening and closing sections. The middle section provides expanded detail on events, area-specific controls, and the worked example for those wanting a deeper understanding of how automation operates in practice.
What Shop Floor Automation Means in Faerûn
In the workshops, kitchens, forges, and docks of Faerûn, work does not pause to wait for parchment and ink. As trade volume increased, the Waterdeep Trading Company found that memory, shouted confirmations, and end-of-day notes could no longer protect quality or coin.
Shop floor automation in Faerûn is the practice of observing work as it happens and recording it at the exact moment of change. Runes shift, seals bind, counters advance, and ledgers update without delay. This is not about replacing workers or removing judgment. It is about defining clear stations, clear states, and clear outcomes so that work can speak for itself.
When ingredients are issued, a batch formally exists. When heat reaches its required level, the heating step is complete. When a seal is applied, inventory becomes real. Each change in state carries meaning, and each meaning is recorded at once. The shop floor becomes the source of truth.
Why It Matters to the Waterdeep Trading Company
As operations expanded, three risks emerged simultaneously. Work was being completed without timely records, costs were absorbed without being traced, and goods were moving before proof existed that they should.
Automation closes these gaps by ensuring that every meaningful change creates a record at the moment it occurs. Nothing relies on recall, and nothing waits for a clerk to catch up. For a company operating across Waterdeep, Baldur’s Gate, Silverymoon, and beyond, this consistency is not a luxury. It is the foundation of trustworthy trade.
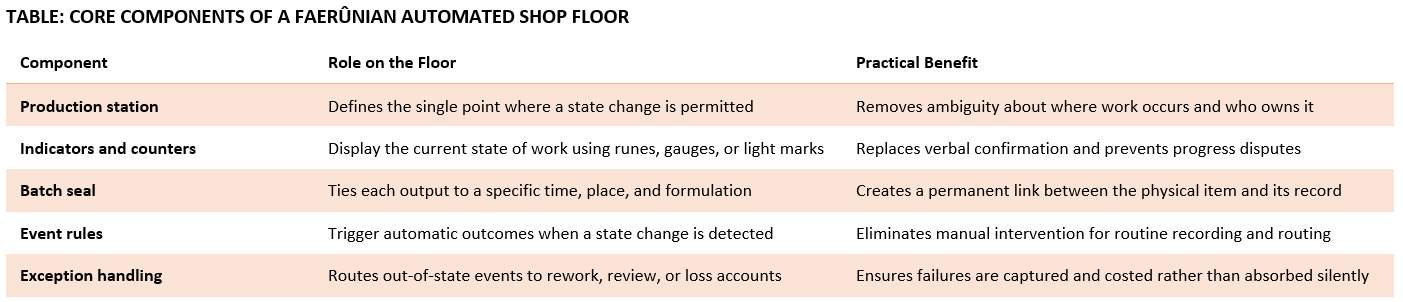
Core Components of a Faerûnian Automated Floor
Production begins at clearly defined stations, each responsible for a single type of action such as mixing, heating, shaping, sealing, or packing. A station is not just a place; it is the point where the state is allowed to change.
Indicators and counters make those state changes visible. Runes, scales, gauges, and light marks show whether work is idle, active, complete, or failed. These replace verbal confirmation and remove ambiguity from progress checks.
Every output receives a batch seal tied to time, place, and formulation. The seal acts as both permission and proof, linking the physical item to its recorded history.
Event rules connect state changes to outcomes. When a state changes, inventory may be recorded, cost captured, release blocked, or review requested, all without waiting for human intervention.
The following table summarizes each core component, its role on the floor, and the practical benefit it delivers to the Waterdeep Trading Company.
Events That Drive Automation
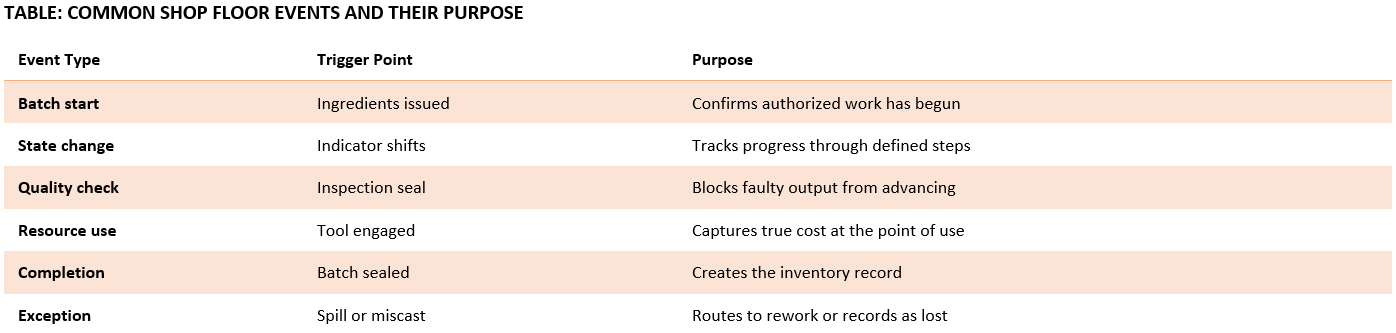
Automation depends on recognizing events rather than intentions. A batch does not exist because someone planned it; it exists because ingredients were issued. A step is not complete because time passed; it is complete because an indicator changed state.
The following table identifies the most common shop floor events, their triggers, and the purpose each serves in the production record.
Each event is small on its own, but together they create full visibility into how work moves across the floor. The power of this approach is that no single worker is responsible for maintaining the full picture. The floor assembles itself automatically, event by event.
It is also worth noting what these events are not. They are not scheduled reminders or periodic reviews. They fire at the moment of change, which means the record is always current, never reconstructed from memory, and never dependent on a clerk completing their rounds.
Automated Tracking by Area
Different production environments present different challenges, and automation must be configured to match each one. The following sections describe how the Waterdeep Trading Company applies event-based tracking across its four primary operational areas.
Alchemical and Craft Production
In alchemical workshops and craft halls, formulations are locked to approved versions. A station configured for a specific blend will refuse inputs from outdated or unapproved formulas before work begins. Any substitution of an ingredient or supplier immediately flags the batch for review rather than allowing production to continue on an untested basis.
This prevents unsafe output from reaching the warehouse and ensures that strength, composition, and consistency remain within the tolerances set by the guild’s master artificers. When a batch is flagged, it moves to a holding state until a qualified inspector reviews and either approves or rejects it. The cost of the flagged batch is captured regardless of outcome, so waste is never invisible.
Kitchens and Food Halls
In kitchens and guild dining halls, cooking stations track both portions prepared and portions issued. Daily preparation limits are enforced automatically; when a threshold is reached, the station closes, and preparation stops without requiring a supervisor to intervene.
Rollover rules define what happens to prepared food at the close of each day. Depending on the item and the guild contract in place, food may be transferred to same-day service, logged as waste, or scheduled for disposal. These rules keep illness risk low and ensure that waste is recorded as a real cost rather than quietly absorbed into overhead.
Forges and Workshops
In forges and manufacturing workshops, tools and molds are treated as shared resources with defined availability states. When a tool is assigned to a batch, it cannot be assigned elsewhere until it is released. This prevents double-booking and ensures that the tool cost recorded against a batch reflects actual usage rather than an estimate.
Wear and repair needs are logged as events rather than complaints. When a tool reaches a defined usage count or shows signs of degradation, a maintenance event is created automatically. This makes repair needs visible before failure occurs, protecting both the tool and the production schedule that depends on it.
Docks and Warehouses
On docks and in warehouse facilities, arrival and departure are recorded at the moment of physical movement. Each load is tied to a batch seal, a route designation, and a named handler. When a discrepancy appears between what was dispatched and what arrived, the record points immediately to the point of separation rather than requiring a full investigation of all parties in the chain.
This is especially valuable for the Waterdeep Trading Company’s long-haul routes between the Sword Coast and inland cities such as Neverwinter, Silverymoon, and Baldur’s Gate, where goods may pass through multiple hands and several days of travel before reaching their destination.
Station Design and Flow Principles
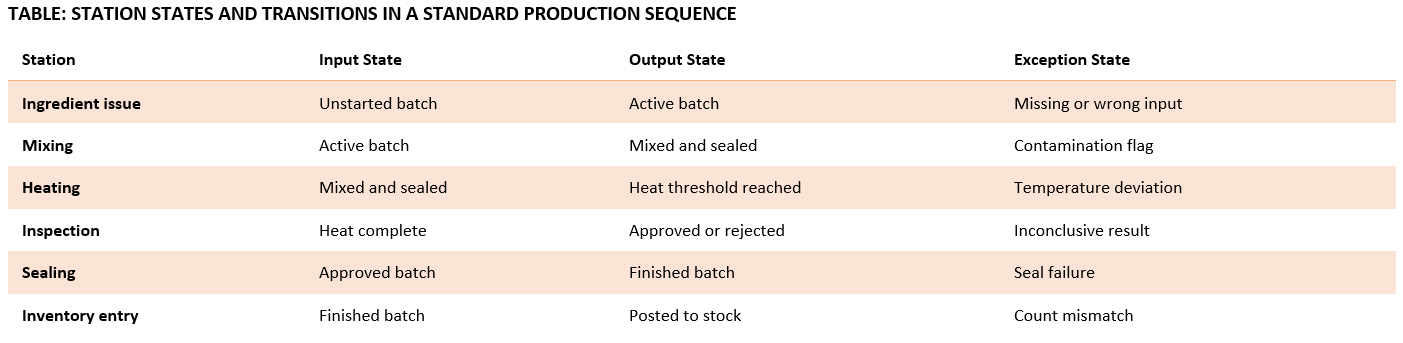
A well-designed automated floor is organized so that each station has exactly one input state and one output state. Work enters a station in a defined condition, and it leaves in a different, defined condition. Anything outside those two states is an exception.
The following table illustrates a standard station sequence for craft production and the state transitions that automation tracks at each point.
Each transition is recorded as an event. If a station skips a state, the system flags the gap. If a state is repeated, it is logged as a duplicate. Neither is allowed to pass silently.
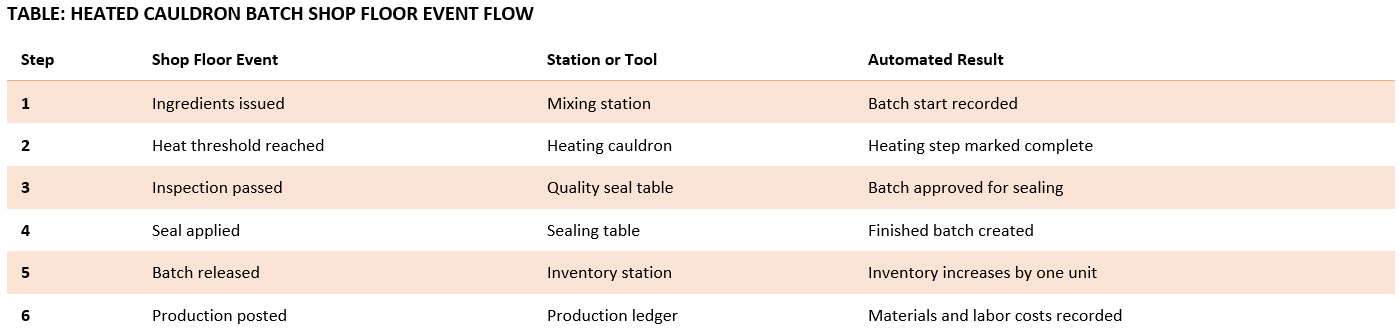
Worked Example: Automated Heated Cauldron Batch
The following example traces a single heated cauldron batch through the Waterdeep workshop from first issue to final inventory entry. Each step represents a change in state, not a task recalled later.
When the seal is applied at step four, the inventory record and cost entry are already prepared. No notes are rewritten, and there is no delay between the work done and the records being updated. If the inspection at step three had failed, the batch would have moved to a rework or loss state, and both the cost of materials and the cost of the failed inspection would have been captured before any further action was taken.
The floor reports for itself. Every cauldron that leaves the workshop carries a full history of how it was made, who touched it, and what it cost.
Controls and Safeguards
Automation strengthens oversight rather than weakening it. Stations cannot proceed without correct inputs, seals cannot be reused, and exceptions require review before release. Every action leaves a trace that can be followed back to its origin.
This protects both the product and the company name associated with it. For a guild operating across multiple cities, that protection is a commercial asset as much as it is an operational one.
Realms-Aware Considerations
Faerûn is not uniform, and automation must respect that. Magic-dense cities such as Waterdeep and Silverymoon support fine-grained indicators and real-time runic tracking. Frontier towns and rural waypoints rely on simpler marks paired with manual confirmation steps.
Guild rules may impose additional checks on top of standard event flows, particularly in trades regulated by bodies such as the Baldur’s Gate Blacksmiths Guild or the Arcane Artificers and Alchemists Union. Seasonal conditions, festival disruptions, and caravan delays can also affect timing and flow, and the event model must account for pauses without treating them as failures.
Automation works best when it matches the place it serves. A system designed for a Waterdeep forge will need adjustment before it is useful in a Luskan dockyard.
Final Thoughts
Shop floor automation in Faerûn gives work a voice. When production speaks at the moment, it changes, losses shrink, quality stabilizes, and ledgers remain true. The Waterdeep Trading Company does not rely on memory to run its operations. It relies on events, states, and seals, as well as a floor that records itself.
For any guild looking to grow without losing control, this discipline is not optional. It is the difference between a ledger that reflects what happened and a ledger that reflects what someone hoped happened.
Support the AD&D365 Project on Patreon.
To grow this world, we’ve launched an official Patreon page where supporters can access exclusive content, tools, and training labs, and even influence the project’s future. Your support fuels more than just development; it expands the guildhall, forges new scrolls, and empowers the next generation of configuration wizards. Begin your journey: https://www.patreon.com/adnd365/
A Grateful Salute to Our Patrons
To everyone who supports this world, thank you for helping keep it alive and growing.
Our Benefactor:Andre Breillatt. Your generosity powers the heart of this project. Because of you, everything continues to grow and move forward.
Our Apprentices:Michael Ramirez and Andreth Bael’Rathyn‡. The engines keep turning, and the training halls stay alive because of you.
With special thanks to our past Apprentices, whose early support built the foundation: Ralf Weber, Wendy Rijners, Shashi Mahesh, Julia Tejera, Ben Ekokobe, Tiago Xavier, Naveen Boyinapelli, Marcos Tadeu Wolf, Kathryn Greene, Jason Brown, Mark Christy, and Ashish Singh.
Our Initiates:Sarah D. Morgan, Jesper Livbjerg, Harry Burgh, Martin Frahm, Gregory Brigden, and Peter Lorre. You’ve stepped beyond watching and into shaping what this becomes.
Our Followers:Rusty Cavalier, Eric Shuss, and Michael Ramirez. Your steady backing keeps progress steady.
Our Voyeurs (Free Members):Deborah, Zarana, Daniel Tchakounte, Will Morrison, Danuelle Geldenhuys, Stuart, JoeNorthMan, Kshitiz Sinha, Michael A., Danijel Vucic, Damio, Zamir Gori, LK, Reza Al, Amith Prasanna, Suprit Naregal, Monika Duplessis, Brianna Otto, PW, Laura J, Alan Megahy, Carsten, Carri, Marcel Barrow, Greg, Ahmet, Franky, Abdullah, Basil Quarrell, Abdelrahman Nabil, NPC, Manimaran Shanmugam, and Shoaib Rafi. Ever watching from the shadows, curious but not yet parting with a single gold piece. Your quiet interest is noticed and lightly judged.
Want to design your own economic models in Faerûn? Get your own AD&D365 Environment and guides at adnd365.com/start, and request access to the public view of the current database at https://public.adnd365.com – Login npc@adnd365.com, Password N0nPl@yC#822!
Rolling cart inventory management is the practice of treating mobile material carts as formal, governed sub-locations within a warehouse structure. This article explains how the Waterdeep Trading Company assigns items to carts, sets par levels to prevent stockouts, and follows a disciplined restocking cycle across its forge halls, enchanting workshops, and dispatch stations. Operations managers, materials planners, and guild inventory stewards will find this guide useful for establishing or improving cart-level controls at any site across Faerûn.
Introduction
Across the markets of Waterdeep, within the forge halls of Baldur’s Gate, and along the trade routes stretching toward Silverymoon, the Waterdeep Trading Company relies not only on grand warehouses and guarded vaults, but on something far humbler: the rolling cart.
Whether stationed beside an enchanter’s bench, a blacksmith’s anvil, or a packing table in the dispatch hall, rolling carts act as mobile inventory nodes. When managed well, they reduce wasted motion, prevent stockouts, and protect margins. When neglected, they become silent drains on coin and productivity.
In a formal inventory structure, a rolling cart is treated as a sub-location within a warehouse. Each cart carries its own assigned site, warehouse code, location identifier, storage dimension group, and default replenishment policy. Rather than forcing artisans to retrieve materials from a distant rack or vault, carts position high-usage items within arm’s reach. This increases throughput and reduces idle labor, and, from a materials management standpoint, the cart serves as a controlled buffer between bulk storage and production consumption.
What Is Rolling Cart Inventory Management?
Rolling cart inventory management is the structured control of materials stored in mobile carts that support production, repair, enchantment, or packing operations. It includes defining which items belong on each cart, setting minimum and maximum quantities, tracking consumption against production orders, replenishing from central warehouse stock, and counting inventory on a scheduled basis.
Unlike primary warehouse inventory, cart inventory turns quickly and is at a higher risk of shrinkage, misplacement, or undocumented use. For that reason, governance must be tighter, not looser.
Why It Matters
Poorly managed carts lead to hidden shrinkage, duplicate purchases, production delays, and the need for emergency procurement at premium prices. Across multiple sites and product lines, these losses compound quickly and erode the margins that keep a trading company competitive.
Well-managed carts produce measurable gains: reduced idle labor time, lower overall warehouse movement, predictable consumption trends, and improved gross margin control. Rolling carts may seem modest in isolation, but across the full network of Waterdeep Trading Company operations, their collective financial impact is anything but minor.
Materials Management at the Cart Level
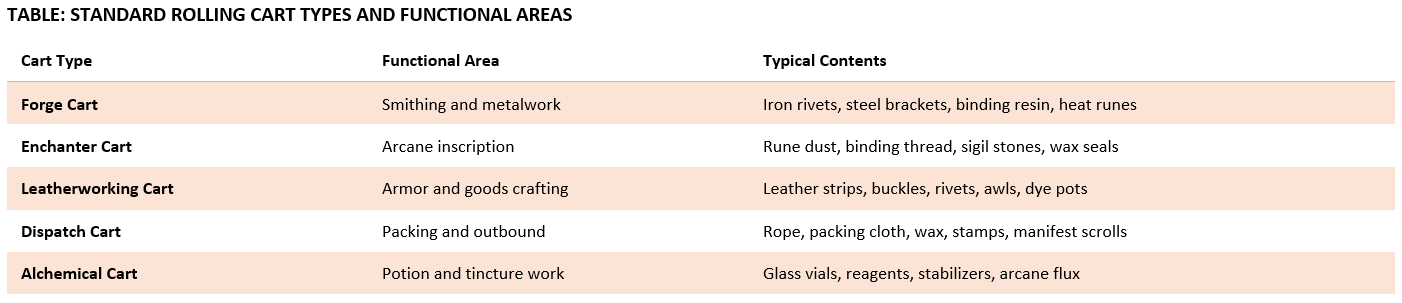
Rolling carts typically hold fast-moving raw materials, small components and fittings, consumables such as oil, flux, ink, or arcane dust, and frequently used enchanted parts. The Waterdeep Trading Company assigns each cart to a functional area aligned with production routing.
The table below lists the standard cart types used across Waterdeep Trading Company operations, along with their assigned areas and typical contents.
Each cart has a predefined item list that aligns with its production routing. Only approved items may be stocked; no bulk reserve inventory is held on carts. Every withdrawal must be posted to a production or service order, and each cart is assigned to a named, responsible guild member. This transforms the cart from a loose supply tray into a managed micro-warehouse.
Establishing Par Levels
Par levels define how much of each item must remain on the cart to support uninterrupted operations. The Waterdeep Trading Company uses a straightforward but disciplined formula:
Daily Usage multiplied by Lead Time, plus Safety Buffer, equals Par Level.
The safety buffer accounts for demand spikes, delivery delays, and seasonal variation. Without it, even a single missed replenishment can halt production run and trigger costly emergency procurement.
The table below shows a sample par configuration for a Forge Cart, including the maximum working quantity, the replenishment trigger point, and the required buffer to prevent disruption.
Par levels are reviewed quarterly or whenever demand patterns shift significantly. Sites operating in remote or high-risk locations should increase safety buffers to account for longer, less predictable lead times.
The table below shows how par level adjustments might apply across different regions of Faerûn for the same item.
This comparison illustrates why a single company-wide par level is insufficient. Each site must be assessed on its own supply conditions.
Restocking Process and Governance
Restocking is not a casual refill. It follows a defined workflow that ensures every movement of materials is recorded and verified. The five steps below represent the standard restocking cycle used by the Waterdeep Trading Company.
Step 1. Consumption Posting. Materials issued from the cart must be tied to a production order, sales order, or internal job before they leave the cart location. Unposted withdrawals are a primary source of inventory shrinkage and must be treated as a control failure.
Step 2. Reorder Trigger. When the on-hand quantity reaches the reorder point, a replenishment request is generated automatically or flagged to the cart steward. The trigger should be monitored daily in high-volume environments.
Step 3. Internal Transfer. Warehouse staff transfer the required materials from bulk storage to the cart location using a formal transfer journal. No materials should move without a corresponding document, even for internal movements.
Step 4. Verification Count. The cart steward confirms that quantities match the transfer journal before providing sign-off. Discrepancies must be investigated before the transfer is closed.
Step 5. Audit Cycle Count. Due to high turnover, carts are counted weekly as part of the standard inventory audit cycle. Surprise counts should also be performed at least monthly to identify unrecorded withdrawals and assess compliance.
Replenishment Models
The Waterdeep Trading Company applies three replenishment models depending on material type, volume, and supply conditions. Selecting the wrong model for a given item can result in either chronic shortages or wasteful overstocking.
Fixed Par Replenishment refills the cart back to its full par level each time a reorder is triggered. This model works best for high-volume standard components consumed consistently across production runs. It is simple to manage and easy for cart stewards to verify at a glance.
Minimum Trigger Replenishment initiates a restock only when the reorder point is reached. This suits mid-volume materials where demand is predictable but not constant. It reduces unnecessary material movement and keeps warehouse labor costs lower than with a fixed-par approach.
Demand-Based Replenishment ties restocking to scheduled production orders rather than fixed thresholds. This model is best for rare arcane components or controlled substances where over-ordering carries risk, whether due to cost, storage restrictions, or guild regulations. Restocking quantities are calculated from confirmed order requirements rather than standing par targets.
The table below summarizes when each model is most appropriate.
Risk Areas and Control Measures
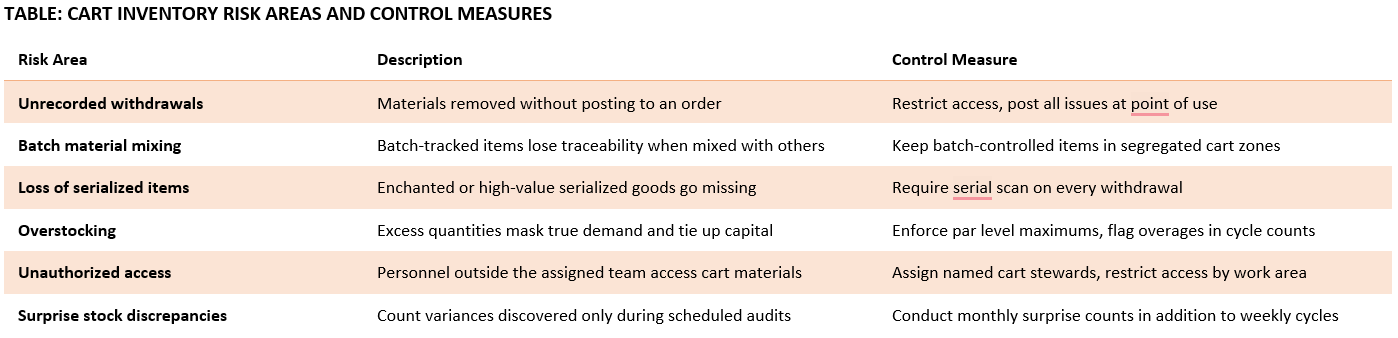
Rolling carts introduce risk due to their mobility and accessibility. Unlike fixed rack locations, carts can be moved, shared between work areas, or accessed by personnel outside their assigned team. The table below identifies the most common risk categories and the controls the Waterdeep Trading Company applies to address them.
Proper tracking dimensions prevent traceability failures and protect the integrity of production records. Any control gap at the cart level can propagate through costing, batch tracking, and financial reporting, making what appears to be a minor operational issue into a significant audit concern.
Realms-Aware Considerations
The geography and infrastructure of Faerûn introduce variables that a simple par formula cannot always capture. In cities like Waterdeep, lead times are short, and replenishment can occur daily. In frontier settlements near the High Forest or along extended caravan routes, restocking delays may span several tendays, requiring par levels to be increased accordingly.
Arcane materials also require special storage conditions, which can restrict which carts are permitted to carry them. Guild regulations may further define handling protocols, particularly for enchanted or alchemical components. Operations managers should review cart configurations whenever a new site is established or when trade route conditions change significantly.
Final Thoughts
Rolling carts are not minor conveniences. They are controlled inventory nodes that support production efficiency across Faerûn. When governed through disciplined materials management, defined par levels, and structured restocking, they strengthen operational reliability and protect the coin of the Waterdeep Trading Company. Even the smallest mobile shelf, when managed with care, contributes to stable margins and uninterrupted trade.
Support the AD&D365 Project on Patreon.
To grow this world, we’ve launched an official Patreon page where supporters can access exclusive content, tools, and training labs, and even influence the project’s future. Your support fuels more than just development; it expands the guildhall, forges new scrolls, and empowers the next generation of configuration wizards. Begin your journey: https://www.patreon.com/adnd365/
A Grateful Salute to Our Patrons
To everyone who supports this world, thank you for helping keep it alive and growing.
Our Benefactor:Andre Breillatt. Your generosity powers the heart of this project. Because of you, everything continues to grow and move forward.
Our Apprentices:Michael Ramirez and Andreth Bael’Rathyn‡. The engines keep turning, and the training halls stay alive because of you.
With special thanks to our past Apprentices, whose early support built the foundation: Ralf Weber, Wendy Rijners, Shashi Mahesh, Julia Tejera, Ben Ekokobe, Tiago Xavier, Naveen Boyinapelli, Marcos Tadeu Wolf, Kathryn Greene, Jason Brown, Mark Christy, and Ashish Singh.
Our Initiates:Sarah D. Morgan, Jesper Livbjerg, Harry Burgh, Martin Frahm, Gregory Brigden, and Peter Lorre. You’ve stepped beyond watching and into shaping what this becomes.
Our Followers:Rusty Cavalier, Eric Shuss, and Michael Ramirez. Your steady backing keeps progress steady.
Our Voyeurs (Free Members):Deborah, Zarana, Daniel Tchakounte, Will Morrison, Danuelle Geldenhuys, Stuart, JoeNorthMan, Kshitiz Sinha, Michael A., Danijel Vucic, Damio, Zamir Gori, LK, Reza Al, Amith Prasanna, Suprit Naregal, Monika Duplessis, Brianna Otto, PW, Laura J, Alan Megahy, Carsten, Carri, Marcel Barrow, Greg, Ahmet, Franky, Abdullah, Basil Quarrell, Abdelrahman Nabil, NPC, Manimaran Shanmugam, and Shoaib Rafi. Ever watching from the shadows, curious but not yet parting with a single gold piece. Your quiet interest is noticed and lightly judged.
Want to design your own economic models in Faerûn? Get your own AD&D365 Environment and guides at adnd365.com/start, and request access to the public view of the current database at https://public.adnd365.com – Login npc@adnd365.com, Password N0nPl@yC#822!
Physical assets across Faerûn differ by how they exist in space. Some occupy a single location, some stretch between points, and some cover entire areas. Each type behaves, fails, and incurs different costs. The Waterdeep Trading Company classifies its holdings into point-based assets (warehouses, towers), linear assets (roads, walls), and polygon-based assets (districts, mining claims). This classification determines inspection schedules, maintenance strategies, accounting treatment, and risk management. Understanding these distinctions prevents waste, protects coin, and keeps trade flowing even when disaster strikes.
Introduction
In the bustling realm of Faerûn, the Waterdeep Trading Company controls more than goods and coin. From the stone docks of Baldur’s Gate to the winding Trade Way and the fortified warehouses of the Dock Ward, the company manages a vast network of physical holdings. Roads, warehouses, docks, districts, mines, caravan routes, and fortified towers all fall under its stewardship.
But not all assets are the same. A warehouse is not a road. A road is not a mining claim. Each behaves differently, creates different costs, and carries different risks. Treating them all as simple ledger entries leads to poor records, weak cost control, and disputes with guilds and city rulers.
To avoid this, the Waterdeep Trading Company classifies its physical assets into three distinct types: point-based, linear, and polygon-based. This classification is not an academic exercise. It reflects how assets actually exist in space, how they fail, and how they must be maintained.
What These Asset Types Are
Physical assets differ in how they exist in space. Some exist at a single location. Some stretch from one place to another. Some cover an entire area. Each type needs its own rules for value, upkeep, and control.
Point-based assets exist at a single fixed location, with a clear position and defined footprint. Warehouses, dock cranes, watchtowers, city gates, and market stalls all qualify. You can mark them on a map with one dot.
Linear assets run from one location to another with length and direction. Trade roads, caravan routes, city walls, aqueducts, and tunnels all function this way. They have multiple points of failure along their length.
Polygon-based assets cover an area with boundaries and internal variation. Mining claims, market districts, warehouse compounds, port zones, and agricultural estates all represent this type. They cannot be reduced to a single point or line.
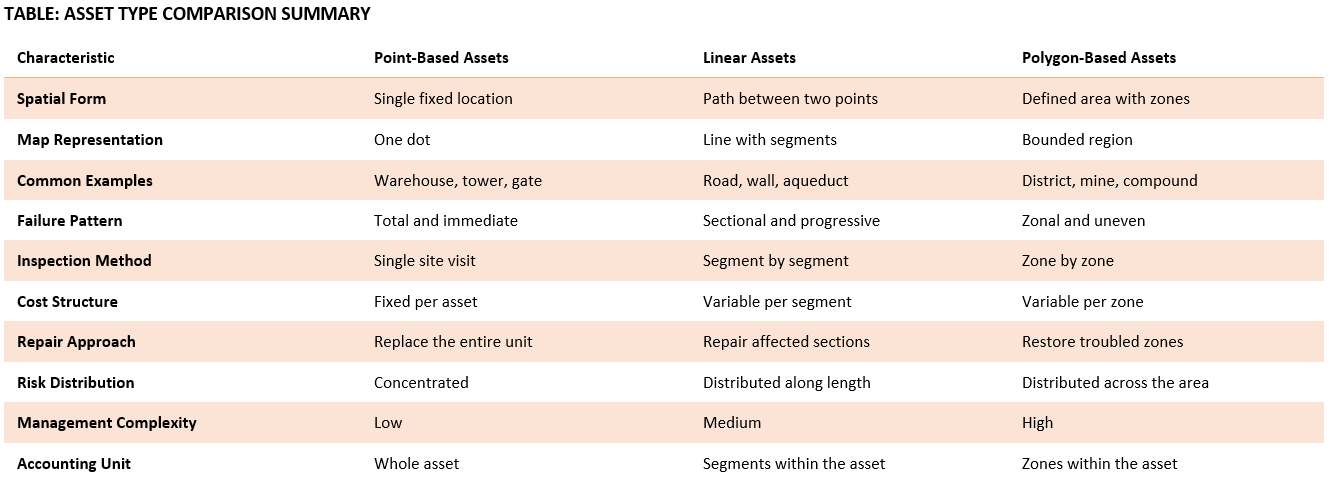
The following table summarizes the key characteristics of each asset type, showing how they differ in spatial existence, failure patterns, management complexity, and accounting treatment. This comparison provides a foundation for understanding why classification matters.
Why the Classification Matters
Treating all assets the same causes errors. Point assets fail suddenly. Linear assets fail locally. Polygon assets fail unevenly. Each type needs different inspection cycles, cost posting rules, risk planning, and control methods.
The Waterdeep Trading Company avoids disputes, losses, and surprise costs by keeping these distinctions clear. When a guild challenges ownership, the company knows exactly what is claimed. When a disaster strikes, the company knows exactly what is lost. When costs rise, the company knows exactly where to cut.
This is not abstract theory. This is practical survival in a world where roads collapse, warehouses burn, and mining claims flood. The company that correctly classifies its assets is the one that stays profitable.
Point-Based Assets: Single Location Holdings
A point-based asset exists at one fixed location. It has a clear position, a defined footprint, and a single set of ownership records. You can mark it on a map with one dot and know exactly what you control.
Common Examples in Faerûn
Warehouses in Waterdeep, dock cranes at a harbor, watchtowers along the Trade Way, city gates, arcane relay towers, and market stalls owned outright all qualify as point-based assets. Each has a single address, a single deed, and a single point of failure.
Why It Matters
Point assets are easy to value and audit. They have clear ownership, direct maintenance costs, and can be secured or lost as a whole. When a warehouse burns, the entire asset is affected at once. When a watchtower falls to raiders, the loss is complete and immediate.
This makes point assets straightforward to insure, defend, and replace. The costs are predictable. The risks are visible. The control is absolute.
Operational Management
Point assets require single-point inspections. The entire asset can be assessed in one visit. Guards can be posted at one location. Repairs affect the whole structure at once. Insurance premiums are calculated on total replacement value.
The company maintains detailed records for each point asset, including construction date, original cost, accumulated depreciation, current condition rating, and estimated remaining useful life. Annual inspections determine whether the asset remains serviceable or requires major intervention.
Accounting Treatment
Point assets are treated as capital holdings. They are capitalized at purchase or construction cost, depreciated over time, and repaired or replaced as single units. When the company buys a warehouse, the full purchase price is recorded as an asset. When it burns, the full value is written off.
Depreciation is calculated using the straight-line method based on the expected useful life. A stone warehouse might depreciate over 50 years. A wooden market stall might depreciate over 15 years. Major improvements extend useful life and increase book value. Minor repairs are expensed in the current period.
The following table shows typical point assets and the main costs the Waterdeep Trading Company tracks for each type. These cost drivers determine how much the company spends annually to keep each asset operational and protected.
Risk Assessment
Point assets face concentrated risk. A single fire, flood, or raid can destroy the entire holding. This makes location selection critical. Warehouses near water sources are at risk of flooding. Watchtowers in contested territory face the risk of raids. Market stalls in high-traffic areas face a higher risk of theft.
The company mitigates risk through strategic placement, redundant holdings, and comprehensive insurance. No single point asset carries more than 10 percent of the company’s total property value. This prevents catastrophic loss from a single incident.
Linear Assets: Path and Boundary Holdings
A linear asset runs between two locations. It has length, direction, and multiple points of failure. Unlike a point asset, a linear asset cannot fail all at once. Damage in one section affects the whole, but the asset continues to exist in parts.
Common Examples in Faerûn
Trade roads, caravan routes, city walls, aqueducts, underground tunnels, and river shipping lanes under charter all function as linear assets. A road from Waterdeep to Daggerford is one asset, but damage at any mile affects the whole. A city wall protects an entire perimeter, but a breach in one section compromises the entire defense.
Why It Matters
Linear assets fail in sections, not all at once. Costs vary by segment. Risk changes by location. A bridge collapse impacts trade even if the rest of the road is intact. A wall breach in one quarter does not mean the entire fortification must be rebuilt.
This makes linear assets more complex to manage. Inspection must be continuous. Repairs must be targeted. Risk assessment must be granular. The company that treats a road as a single unit will waste coin repairing strong sections while ignoring weak ones.
Operational Control
The company tracks linear assets by segments. Each segment has length, condition, upkeep cost, and risk rating. This allows partial closures and targeted repairs. When a bridge on the Trade Way collapses, the company closes only the affected segment. Trade is rerouted. Repairs are budgeted for one section, not the entire road.
Segment length is determined by natural divisions. Bridges, gates, and terrain changes all mark segment boundaries. A road through flat farmland might be segmented every 10 miles. A road through mountains might be segmented at every pass, bridge, and switchback.
Condition ratings follow a standard scale: Excellent, Good, Fair, Poor, Critical. Excellent segments require minimal maintenance. Critical segments require immediate intervention. The company prioritizes repairs based on condition rating and strategic importance.
Accounting Treatment
Linear assets are capitalized as a whole but maintained in parts. Repairs are often expensed per segment. Major rebuilds increase asset value. A complete road repaving increases the asset’s capitalized value. A minor pothole repair is expensed in the current period.
The total asset value is divided proportionally by segment length and quality. A stone-paved segment in good condition carries a higher book value than a dirt segment in poor condition. This allows precise loss calculation when a segment fails.
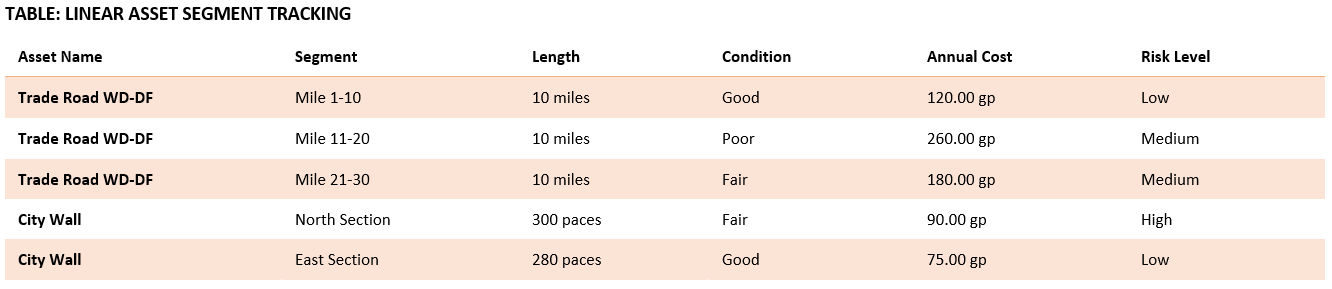
The following table demonstrates how the Waterdeep Trading Company divides linear assets into manageable sections for tracking condition and maintenance costs. Each segment is monitored separately, allowing precise cost control and targeted intervention.
Risk Assessment
Linear assets face distributed risk. Damage to one segment degrades the entire asset but does not destroy it. This creates complex risk scenarios. A road with one weak bridge is only as reliable as that bridge. A wall with one breached section is only as secure as that breach.
The company conducts rolling inspections, reviewing each segment on a scheduled cycle. High-risk segments are inspected quarterly. Low-risk segments are inspected annually. This prevents surprise failures and allows proactive maintenance.
Weather patterns, bandit activity, monster migration routes, and political instability all affect segment risk ratings. A road through peaceful farmland has a low risk. A road through contested borderlands has a high risk. The company adjusts maintenance budgets and insurance premiums accordingly.
Segment Optimization
The company continuously evaluates whether to maintain, reroute, or abandon segments. A road segment that costs more to maintain than it generates in toll revenue is a candidate for abandonment. A wall segment that protects nothing of value is a candidate for decommissioning.
This optimization prevents wasted resources. The company does not maintain roads that no one travels or walls that protect empty fields. Resources are concentrated on segments that generate value and protect critical holdings.
Polygon-Based Assets: Area and Territory Holdings
A polygon-based asset covers an area. It has boundaries, internal variation, and shared control. Unlike point assets, which exist at a single location, or linear assets, which stretch between two points, polygon assets occupy space. They have zones, districts, and territories within their boundaries.
Common Examples in Faerûn
Mining claims, forested timber rights, market districts, warehouse compounds, port zones, agricultural estates, and city wards under charter all represent polygon-based assets. These assets cannot be reduced to a single point or line. They have internal complexity, varied terrain, and multiple sources of value.
Why It Matters
Polygon assets generate value across space. Different sections may earn different revenue, face different risks, or require different upkeep. A mine produces more in one vein than another. A district has streets that profit and streets that drain coin. A warehouse compound has yards that earn rent and yards that sit empty.
This makes polygon assets the most complex to manage. Value is distributed unevenly. Costs are hard to predict. Risk varies by zone. The company that treats a market district as a single asset will miss the profitable streets and overpay for the failing ones.
Operational Control
Polygon assets are divided into zones for management and accounting. Each zone has defined boundaries, assigned use, revenue potential, and cost structure. The company tracks performance by zone, identifying which areas generate profit and which areas drain resources.
Zone boundaries follow natural divisions. In a market district, zones might align with streets or blocks. In a mining claim, zones might align with veins or shafts. In a warehouse compound, zones might align with yards or buildings.
Zone use determines value. A loading zone generates more revenue than a storage zone. An active mining zone generates more revenue than a flooded zone. A high-traffic market zone generates more revenue than a back-alley zone.
Accounting Treatment
Polygon assets are often treated as controlled territories. Value comes from output, rent, taxation rights, and access control. Costs are tracked by zone within the area. When the company controls a mining claim, it does not record one asset. It records multiple zones, each with its own cost structure and revenue potential.
Total asset value is allocated by zone based on productive capacity and revenue history. A zone that generates 40 percent of total revenue carries 40 percent of total asset value. This allows precise profitability analysis and investment decisions.
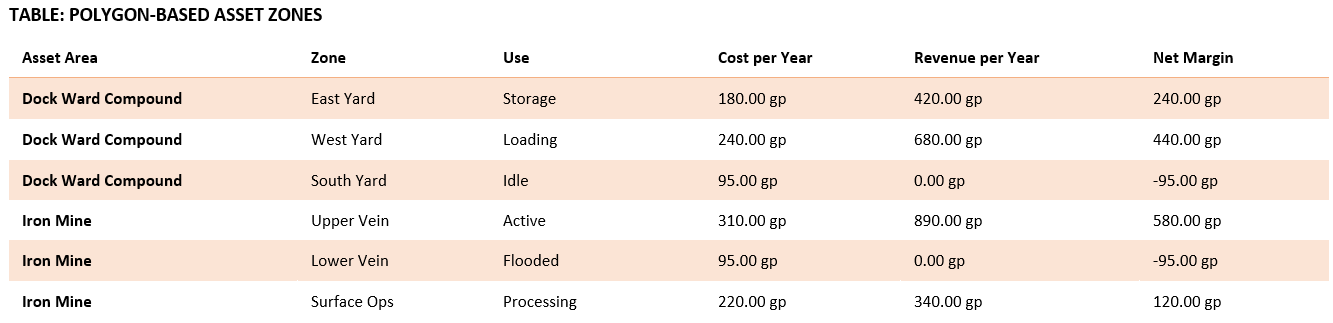
The following table illustrates how area-based assets are divided into zones, each with its own use classification and annual cost allocation. This zoning approach allows the company to identify which areas generate profit and which areas drain resources.
Risk Assessment
Polygon assets face zoned risk. Damage to one zone degrades that zone but may not affect others. A fire in one warehouse yard does not burn the entire compound. A collapse in one mine shaft does not close the entire mine. A riot in one market street does not shut down the entire district.
This creates risk management opportunities. The company can isolate high-risk zones with barriers, separate operations, and independent access. A flooded mine shaft is sealed off while other shafts continue production. A riot-prone market street is fenced while other streets continue to trade.
However, polygon assets also face systemic risk. A plague in one district zone can spread to others. A fire in one compound yard can jump to others. Contamination in one mine vein can poison others. The company must balance zone isolation with systemic monitoring.
Zone Optimization
The company continuously evaluates zone performance and allocation. Underperforming zones are candidates for reallocation, subleasing, or abandonment. The South Yard in the table above generates no revenue but costs 95 gold pieces annually. The company has three options: find a tenant, repurpose the space, or abandon it.
High-performing zones receive additional investment. The West Yard generates the highest margin in the compound. The company might expand loading capacity, add equipment, or improve access to capture more business. This optimization maximizes return on territory holdings.
Worked Example: Trade Access Between Waterdeep and Daggerford
The company controls trade access between Waterdeep and Daggerford through three distinct asset types. Each serves a different purpose, fails in different ways, and costs differently. Understanding how they interact demonstrates the practical value of asset classification.
The Point Asset: Toll House
The toll house at Waterdeep city gate is a classic point asset. This structure collects fees from all travelers entering the city. It has a single location, a single function, and a single point of failure.
The toll house is valued at 2,400 gold pieces with annual maintenance costs of 180 gold pieces. It generates 3,200 gold pieces in annual toll revenue. If the toll burns, the tolls stop instantly. The entire asset is lost at once. Trade can continue, but revenue collection stops until the structure is rebuilt.
The company maintains fire insurance on the toll house with a replacement value policy. In the event of total loss, insurance covers rebuilding costs minus a 10 percent deductible. This protects the company from catastrophic loss while incentivizing fire prevention.
The Linear Asset: The Road
The road itself stretches 30 miles from Waterdeep to Daggerford. This linear asset has three segments, each with its own condition and cost structure, as shown in the earlier table.
Total road value is 18,000 gold pieces with annual maintenance costs of 560 gold pieces across all segments. The road generates indirect revenue by enabling trade, but its value is measured in trade volume enabled rather than direct tolls.
If the road washes out at one bridge in segment two, trade slows but does not stop everywhere. Caravans reroute through segments one and three at reduced speed. Repairs are budgeted at 1,200 gold pieces for the affected segment only. The asset continues to function at reduced capacity while repairs proceed.
The company prioritizes segment two for major investment because its poor condition creates the highest risk of trade disruption. A 2,000-gold-piece upgrade would improve conditions from Poor to Good, reduce annual maintenance from 260 to 140 gold pieces, and eliminate high-risk closures.
The Polygon Asset: Market District
The bonded market district at the Daggerford end covers 12 acres, divided into six zones. Each zone has different characteristics, costs, and revenue potential. The company holds exclusive trade rights to the district under a charter from the Daggerford City Council.
The total district value is 45,000 gold pieces, with annual costs of 1,850 gold pieces and annual revenue of 6,400 gold pieces. Net margin is 4,550 gold pieces, making this the most profitable component of the trade access system.
If the market district experiences unrest in one zone, revenue drops only in that zone. Some merchants close. Some stay open. The asset degrades in parts, not all at once. The company can isolate troubled zones, increase security, negotiate with local guilds, and restore order incrementally.
Zone three, the central market square, generates 35 percent of total district revenue on only 15 percent of total space. This makes it the most valuable zone per acre. The company invests heavily in maintaining square conditions, strong guild relationships, and a strong security presence to protect this revenue stream.
Integrated Risk Management
Each asset type in this system requires different risk management. The toll house needs fire insurance and security guards. The road needs weather monitoring and segment inspection. The market district needs guild relationships and zone security.
A catastrophic event affects each asset differently. A military invasion might destroy the toll house, block the road, and shutter the market district. But recovery follows different paths. The toll house is being rebuilt as a unit. The road is cleared segment by segment. The market district reopens zone by zone.
Understanding these differences allows the company to prioritize recovery, allocate resources efficiently, and restore trade quickly. The company that treats all three as simple assets will waste time, coin, and opportunity in crisis response.
The Strategic Value of Asset Classification
Point, linear, and polygon-based assets are not abstract ideas. They reflect how land, roads, and holdings actually behave across Faerûn. A warehouse is not a road. A road is not a mining claim. Each has its own rules, risks, and costs.
By classifying assets correctly, the Waterdeep Trading Company protects its coin, plans repairs properly, argues contracts clearly, and keeps trade flowing even when trouble strikes. This classification shapes everything from insurance premiums to maintenance schedules to legal disputes.
Realms Aware Considerations
Faerûn adds extra pressure to asset control. Magic damage is often localized. A fireball strikes one warehouse, not the entire compound. Monsters target roads more than buildings. Bandits attack caravans on open stretches, not fortified gates. City charters define area rights tightly. A market district may belong to the company, but the streets belong to the city.
Guild claims often overlap zones. The Blacksmiths Guild may claim rights to one quarter of a mining district. The Merchants Guild may claim exclusive access to one street in a market. The company that ignores asset type will find itself in legal fights, guild fines, or lost trade privileges.
By correctly classifying assets, the company knows exactly what it owns, what it controls, and what it must defend. This clarity prevents disputes before they start and protects the company’s reputation across Faerûn.
Final Thoughts
Whether you oversee a single warehouse or a network of caravan routes, this classification system will serve you well. The principles are universal. The benefits are immediate. The company that masters asset classification is the company that survives and prospers across Faerûn.
Start with a simple inventory. List every physical asset you control. Mark each as a point, a line, or a polygon. Adjust your ledgers, your inspections, and your risk planning accordingly. The investment is small. The protection is substantial. Your coin, your reputation, and your trade depend on it.
Support the AD&D365 Project on Patreon.
To grow this world, we’ve launched an official Patreon page where supporters can access exclusive content, tools, and training labs, and even influence the project’s future. Your support fuels more than just development; it expands the guildhall, forges new scrolls, and empowers the next generation of configuration wizards. Begin your journey: https://www.patreon.com/adnd365/
A Grateful Salute to Our Patrons
To everyone who supports this world, thank you for helping keep it alive and growing.
Our Benefactors:Rovado and Andre Breillatt. Your generosity powers the heart of this project. Because of you, everything continues to grow and move forward.
Our Apprentices:Michael Ramirez and Andreth Bael’Rathyn‡. The engines keep turning, and the training halls stay alive because of you.
With special thanks to our past Apprentices, whose early support built the foundation: Ralf Weber, Wendy Rijners, Shashi Mahesh, Julia Tejera, Ben Ekokobe, Tiago Xavier, Naveen Boyinapelli, Marcos Tadeu Wolf, Kathryn Greene, Jason Brown, Mark Christy, and Ashish Singh.
Our Initiates:Sarah D. Morgan, Jesper Livbjerg, Harry Burgh, Martin Frahm, Gregory Brigden, and Peter Lorre. You’ve stepped beyond watching and into shaping what this becomes.
Our Followers:Rusty Cavalier, Eric Shuss, Jeff Berberich, and Michael Ramirez. Your steady backing keeps progress steady.
Our Voyeurs (Free Members):Deborah, Zarana, Daniel Tchakounte, Will Morrison, Danuelle Geldenhuys, Stuart, JoeNorthMan, Kshitiz Sinha, Michael A., Danijel Vucic, Damio, Zamir Gori, LK, Reza Al, Amith Prasanna, Suprit Naregal, Monika Duplessis, Brianna Otto, PW, Laura J, Alan Megahy, Carsten, Carri, Marcel Barrow, Greg, Ahmet, Franky, Abdullah, Basil Quarrell, Abdelrahman Nabil, NPC, Manimaran Shanmugam, and Shoaib Rafi. Ever watching from the shadows, curious but not yet parting with a single gold piece. Your quiet interest is noticed and lightly judged.
Want to design your own economic models in Faerûn? Get your own AD&D365 Environment and guides at adnd365.com/start, and request access to the public view of the current database at https://public.adnd365.com – Login npc@adnd365.com, Password N0nPl@yC#822!
In every guild hall across the Sword Coast, from the marble counting houses of Waterdeep to the timber-framed trade posts of Baldur’s Gate, there exists an unspoken question. What separates a thriving merchant house from one that folds after a single bad season?
Adventurers have long been judged by strength, dexterity, constitution, intelligence, wisdom, and charisma. These scores tell the story of what a person can lift, dodge, endure, learn, perceive, and persuade. But guilds and trading companies are not people. They are living systems built on coin, contracts, caravans, and control.
The Waterdeep Trading Company does not measure itself by the arm strength of its porters or the charm of its negotiators. It measures itself by six core business ability scores. Capital Base, Operational Speed, Stability, Planning Acumen, Control Discipline, and Trade Standing. Together, these scores provide a complete picture of how a business performs under pressure, navigates opportunity, and sustains itself across seasons and storms.
This system is used by guild clerks, senior factors, and financial scribes to evaluate performance, compare branches, and make decisions about expansion, investment, and partnerships. The scores are not abstract. They shape daily outcomes, from whether a contract is honored to whether a caravan reaches its destination intact.
This article explains how the Waterdeep Trading Company uses business ability scores to measure organizational health, predict risks, and maintain one of the most respected operations in the Realms.
What Business Ability Scores Are
Business ability scores are numerical ratings that describe the functional capacity of a guild, trading house, or merchant operation. Just as adventurers are rated on a scale of 3 to 18 for physical and mental attributes, businesses are rated on the same scale for operational and financial attributes.
Each score measures a specific dimension of performance. Low scores indicate weakness or vulnerability. High scores indicate strength and resilience. A score of 10 or 11 represents average competence for an established guild. Scores below 8 suggest critical deficiencies. Scores above 15 suggest exceptional capability.
These scores are not static. They shift in response to events, decisions, investments, and market conditions. A guild that loses its warehouse to fire may see its Stability score drop by 3 points. A guild that secures exclusive contracts with the Lords’ Alliance may see its Trade Standing rise by 2 points.
The six core scores are used individually and in combination to calculate derived metrics that describe real operational outcomes.
The Six Core Business Stats
This table defines the primary attributes used to assess a business’s strength and health in Faerûn.
Capital Base, CAP
Capital Base measures financial muscle. It represents the total amount of liquid coin, available credit, vaulted reserves, and purchasing power that a business can deploy on short notice.
A guild with a high Capital Base can afford bulk purchases at discount rates, fund emergency repairs without hesitation, and sustain operations through lean months. A guild with a low Capital Base struggles to keep shelves stocked, cannot negotiate favorable terms, and must turn away profitable opportunities due to a lack of funds.
Capital Base is used when a business needs to outbid rivals, secure rare materials, pay unexpected tariffs, or survive a season where revenue drops below expenses. It determines whether a company controls its suppliers or is controlled by them.
A score of 8 or below means the guild operates hand to mouth, always one delay away from insolvency. A score of 15 or above means the guild can absorb shocks, invest in growth, and dictate terms to weaker partners.
Operational Speed, OPS
Operational Speed measures how fast a business acts. It represents the ability to fulfill orders promptly, reroute caravans in response to danger, process customer requests without delay, and handle surges in demand.
A guild with high Operational Speed completes contracts ahead of schedule, adapts to shifting markets, and captures time-sensitive opportunities. A guild with low Operational Speed creates backlogs, misses deadlines, and loses customers to faster competitors.
Operational Speed is used when goods must be delivered by a specific festival date, when a workshop must pivot to produce a different item on short notice, or when emergency repairs are needed to keep a production line running.
A score of 8 or below means the guild is perpetually behind, with frustrated customers and missed opportunities. A score of 15 or more means the guild sets the pace of the market and can react to changes faster than rivals can plan for them.
Stability, STA
Stability measures endurance under pressure. It represents the ability to absorb losses, withstand delays, survive fines or penalties, and continue operating when circumstances turn hostile.
A guild with high Stability can endure a failed caravan, a spoiled shipment, a warehouse fire, or a contract dispute without collapsing. A guild with low Stability teeters on the edge of ruin, where a single bad event can close its doors permanently.
Stability is used when goods spoil in transit, when bandits destroy a shipment, when tariffs double unexpectedly, when a key partner goes bankrupt, or when a plague disrupts supply chains for months.
A score of 8 or below means the guild has no cushion for error and cannot survive adversity. A score of 15 or above means the guild can weather storms that would destroy lesser operations and emerge intact.
Planning Acumen, PLN
Planning Acumen measures foresight and judgment. It represents the ability to forecast demand, anticipate price shifts, choose reliable suppliers, set profitable margins, and avoid costly mistakes.
A guild with high Planning Acumen purchases materials before prices spike, avoids inventory that will not sell, prices goods to maximize profit without losing customers, and identifies emerging markets before competitors do. A guild with low Planning Acumen overbuys goods that sit unsold, underprices valuable items, and makes purchasing decisions based on guesswork.
Planning Acumen is used to determine how much stock to order for the winter season, decide whether to expand into a new region, set prices for a new product line, or evaluate the reliability of a potential supplier.
A score of 8 or below means the guild makes poor decisions that erode margins and waste resources. A score of 15 or above means the guild anticipates market movements and positions itself ahead of the curve.
Control Discipline, CTR
Control Discipline measures internal order and rule-keeping. It represents the ability to enforce procedures, detect fraud, maintain accurate records, ensure contract compliance, and prevent waste or theft.
A guild with high Control Discipline has clean books, reliable audits, trusted employees, and consistent processes. A guild with low Control Discipline suffers from embezzlement, sloppy record keeping, contract violations, and operational leaks that drain profit.
Control Discipline is used when conducting financial audits, investigating discrepancies in inventory counts, enforcing contract terms with suppliers, or ensuring that employees follow established procedures.
A score of 8 or below means the guild is vulnerable to fraud, mistakes, and regulatory penalties. A score of 15 or above means the guild operates with precision and can be trusted by partners, investors, and guilds.
Trade Standing, REP
Trade Standing measures how the market views the business. It represents reputation, trustworthiness, influence with guilds and nobles, access to favorable credit terms, and the ability to negotiate from a position of strength.
A guild with high Trade Standing enjoys preferred supplier relationships, can secure credit on favorable terms, gains access to exclusive contracts, and receives lenient treatment when disputes arise. A guild with low Trade Standing must pay cash up front, is denied opportunities, and struggles to find partners willing to work with them.
Trade Standing is used when negotiating payment terms, seeking membership in a prestigious guild, applying for licenses or permits, or requesting favors from influential contacts.
A score of 8 or below means the guild is viewed as unreliable and unworthy of trust. A score of 15 or above means the guild opens doors that others cannot access and commands respect across the Realms.
Derived Business Metrics
Core ability scores are useful on their own, but they become even more powerful when combined to calculate derived metrics. These metrics describe specific operational outcomes that matter to daily performance.
This table shows how core stats combine into practical outcomes.
Liquidity
Liquidity is calculated by adding Capital Base and Control Discipline. It measures whether a business can meet its financial obligations when they come due. A guild with high Liquidity has enough coin on hand and disciplined processes to ensure payments are made on time. A guild with low Liquidity may have coin but lose track of when payments are due, or may have excellent record keeping but insufficient funds to cover debts.
Throughput
Throughput is calculated by adding Operational Speed and Stability. It measures the volume of goods that can be moved safely without exceeding the system’s capacity. A guild with high Throughput can handle large orders, seasonal surges, and complex logistics without collapsing under the load. A guild with low Throughput becomes overwhelmed when demand spikes and suffers delays or failures.
Margin Control
Margin Control is calculated by adding Planning Acumen and Control Discipline. It measures how consistently a business generates profit. A guild with high Margin Control prices goods intelligently and enforces cost controls that prevent waste. A guild with low Margin Control makes erratic profits, with some quarters highly profitable and others deeply unprofitable.
Market Reach
Market Reach is calculated by adding Trade Standing and Operational Speed. It measures how far a business can effectively sell its goods. A guild with high Market Reach can deliver products quickly to distant cities and has the reputation to close deals in unfamiliar markets. A guild with low Market Reach is confined to local sales and struggles to expand beyond familiar territory.
Risk Exposure
Risk Exposure is indicated by low Control Discipline. It measures the likelihood of damage from internal failures. A guild with high Risk Exposure is vulnerable to fraud, contract violations, regulatory fines, and operational mistakes that create financial harm.
Reading a Business Profile
To illustrate how these scores work together, consider a mid-sized merchant house operating out of Baldur’s Gate. The house specializes in importing textiles from Calimport and selling them throughout the Sword Coast.
This table shows the ability scores for a fictional merchant house.
Derived Metrics:
Liquidity: 14 + 9 = 23. Adequate ability to meet obligations, though control weaknesses introduce some risk.
Throughput: 10 + 12 = 22. Moderate capacity can handle standard volumes.
Margin Control: 15 + 9 = 24. Good planning is offset by weak controls; profits are strong but inconsistent.
Market Reach: 13 + 10 = 23. Solid reach can sell across the Sword Coast.
Risk Exposure: Control Discipline of 9 indicates an elevated risk of fraud or operational errors.
Interpretation
This merchant house has strong margins and good market standing, but weak controls. Growth has outpaced discipline. The business is profitable and well-positioned for expansion, but a single fraud incident, contract violation, or sloppy record-keeping error could cause significant damage.
The recommended action would be to invest in improving Control Discipline before pursuing further growth. This might include hiring an experienced auditor, implementing stricter inventory checks, or establishing formal approval processes for major expenditures.
Using Business Ability Scores in Daily Decisions
Guild clerks and senior factors use these scores to guide decisions across a range of scenarios.
When evaluating a potential partnership, they compare Trade Standing and Control Discipline scores. A partner with high Trade Standing but low Control Discipline may bring valuable connections but also introduce operational risk.
When planning for seasonal demand surges, they examine Operational Speed and Stability. If both scores are low, the guild may need to decline large orders or risk collapse under the load.
When deciding whether to extend credit to a customer, they review the customer’s Capital Base and Trade Standing. A customer with a strong reputation but weak capital may need shorter payment terms.
When assessing the viability of a new trade route, they calculate Market Reach and compare it with the route’s distance and complexity. If Market Reach is insufficient, the route may fail due to delivery delays or the inability to negotiate favorable terms in unfamiliar cities.
These scores are not abstract academic measures. They are practical tools used daily to evaluate risk, allocate resources, and make choices that determine whether a business thrives or fails.
Realms Aware Considerations
Business ability scores are influenced by location, market conditions, and external events. A guild operating in Waterdeep may have higher Trade Standing due to proximity to influential nobles and guild councils. A guild operating in a frontier settlement may have lower Operational Speed due to limited infrastructure and unreliable supply chains.
Scores can shift rapidly during crises. A plague that disrupts trade routes may reduce Operational Speed and Stability across an entire region. A successful diplomatic mission that secures favorable trade agreements may increase Trade Standing for all guilds affiliated with the sponsoring faction.
Guilds with diversified operations across multiple cities may have different scores in each location. The Waterdeep Trading Company may have a Capital Base of 16 in its home city but only 11 in its Baldur’s Gate branch, reflecting differences in local reserves and access to credit.
Senior factors track score changes over time to identify trends. A steady decline in Control Discipline may indicate that internal processes are breaking down and require immediate attention. A steady increase in Planning Acumen may indicate that recent hires or training programs are paying off.
Final Thoughts
Business ability scores let a guild feel alive, measured, and fallible, just like any adventuring party. They provide a common language for evaluating performance, comparing operations, and making decisions grounded in evidence rather than intuition.
The Waterdeep Trading Company uses these scores to maintain discipline, anticipate risks, and ensure that every branch operates with the strength needed to survive in the competitive markets of Faerûn. Whether managing a warehouse, negotiating a contract, or planning for the next season, these six scores guide every choice and shape every outcome.
Support the AD&D365 Project on Patreon. To grow this world, we’ve launched an official Patreon page where supporters can access exclusive content, tools, and training labs, and even influence the project’s future. Your support fuels more than just development; it expands the guildhall, forges new scrolls, and empowers the next generation of configuration wizards. Begin your journey: https://www.patreon.com/adnd365/
A Grateful Salute to ourPatrons. To all those who stand behind the vision, thank you for helping bring this world to life. Our Benefactors, Andre Breillatt and Eryndor Fiscairn‡, your boundless generosity fuels the arcane core of this project. Without your magic, the weave would falter. OurApprentices, the spell engines turn, and the training labs thrive thanks to our current Apprentices: Michael Ramirez and Andreth Bael’Rathyn‡. Special thanks to our past Apprentices, whose contributions helped us get here: Ralf Weber, Wendy Rijners, Shashi Mahesh, Julia Tejera, Ben Ekokobe, Tiago Xavier, Naveen Boyinapelli, Marcos Tadeu Wolf, Kathryn Greene, Jason Brown, Mark Christy, and Ashish Singh. Our Initiates, Jeff Stiles,Harry Burgh, Jesper Livbjerg, Peter Lorre, Gregory Brigden, and Martin Grahm, your commitment marks the start of the deeper path, stepping beyond mere observation into the active shaping of this realm.Our Followers, your steady presence along the journey is a beacon of encouragement: Rusty Cavalier,Eric Shuss, Sunil Panchal, Sarah D. Morgan, Nick Ramchandani, Daniel Kjærsgaard, and Tomasz Pałys. And our Voyeurs, ever watching from the shadows, clearly intrigued… but not enough to part with a single gold piece. Your silent curiosity is noted and mildly judged.
Want to design your own economic models in Faerûn? Get your own AD&D365 Environment and guides at adnd365.com/start, and request access to the public view of the current database at https://public.adnd365.com – Login npc@adnd365.com, Password N0nPl@yC#822!